
Page 736 - ES 2020-21_Volume-1-2 [28-01-21]
P. 736
Social Infrastructure, Employment and Human Development 363
ANNEXURE I
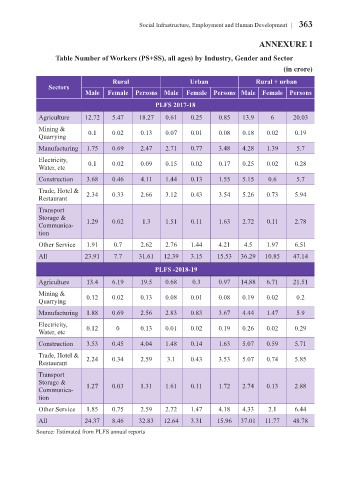
Table Number of Workers (PS+SS), all ages) by Industry, Gender and Sector
(in crore)
Rural Urban Rural + urban
Sectors
Male Female Persons Male Female Persons Male Female Persons
PLFS 2017-18
Agriculture 12.72 5.47 18.27 0.61 0.25 0.85 13.9 6 20.03
Mining &
Quarrying 0.1 0.02 0.13 0.07 0.01 0.08 0.18 0.02 0.19
Manufacturing 1.75 0.69 2.47 2.71 0.77 3.48 4.28 1.39 5.7
Electricity,
Water, etc 0.1 0.02 0.09 0.15 0.02 0.17 0.25 0.02 0.28
Construction 3.68 0.46 4.11 1.44 0.13 1.55 5.15 0.6 5.7
Trade, Hotel &
Restaurant 2.34 0.33 2.66 3.12 0.43 3.54 5.26 0.73 5.94
Transport
Storage & 1.29 0.02 1.3 1.51 0.11 1.63 2.72 0.11 2.78
Communica-
tion
Other Service 1.91 0.7 2.62 2.76 1.44 4.21 4.5 1.97 6.51
All 23.91 7.7 31.61 12.39 3.15 15.53 36.29 10.85 47.14
PLFS -2018-19
Agriculture 13.4 6.19 19.5 0.68 0.3 0.97 14.88 6.71 21.51
Mining & 0.12 0.02 0.13 0.08 0.01 0.08 0.19 0.02 0.2
Quarrying
Manufacturing 1.88 0.69 2.56 2.83 0.83 3.67 4.44 1.47 5.9
Electricity, 0.12 0 0.13 0.01 0.02 0.19 0.26 0.02 0.29
Water, etc
Construction 3.53 0.45 4.04 1.48 0.14 1.63 5.07 0.59 5.71
Trade, Hotel & 2.24 0.34 2.59 3.1 0.43 3.53 5.07 0.74 5.85
Restaurant
Transport
Storage &
Communica- 1.27 0.03 1.31 1.61 0.11 1.72 2.74 0.13 2.88
tion
Other Service 1.85 0.75 2.59 2.72 1.47 4.18 4.33 2.1 6.44
All 24.37 8.46 32.83 12.64 3.31 15.96 37.01 11.77 48.78
Source: Estimated from PLFS annual reports