
Page 129 - ES 2020-21_Volume-1-2 [28-01-21]
P. 129
112 Economic Survey 2020-21 Volume 1
Figure 38: India’s General Government Debt (as % of GDP)
and Sovereign Credit Rating Changes
90%
83% 84% 83%
79%
80% 68% 77% 68%
General Government Debt (% of GDP) 60%
70%
50%
40%
30%
20%
10%
0%
1998-99 1999-00 2000-01 2001-02 2002-03 2003-04 2004-05 2005-06 2006-07 2007-08 2008-09 2009-10 2010-11 2011-12 2012-13 2013-14 2014-15 2015-16 2016-17 2017-18 2018-19
Note: Red signifies year of rating downgrade. Green signifies year of rating upgrade.
Source: IMF
Figure 39: India’s Overall Debt (as per cent of GDP)
and Sovereign Credit Rating Changes
140%
122% 125%
118% 119% 121%
120% 95% 111%
Overall Debt (% of GDP) 80%
100%
60%
40%
20%
0%
1998-99 1999-00 2000-01 2001-02 2002-03 2003-04 2004-05 2005-06 2006-07 2007-08 2008-09 2009-10 2010-11 2011-12 2012-13 2013-14 2014-15 2015-16 2016-17 2017-18 2018-19
Note: Red signifies year of rating downgrade. Green signifies year of rating upgrade.
Source: IMF
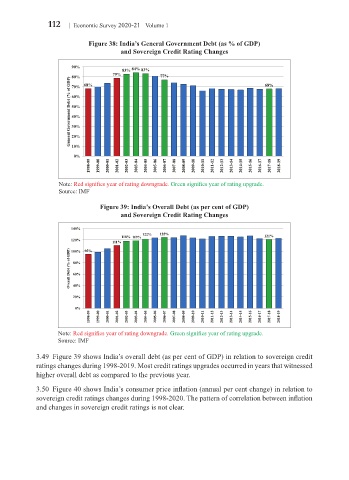
3.49 Figure 39 shows India’s overall debt (as per cent of GDP) in relation to sovereign credit
ratings changes during 1998-2019. Most credit ratings upgrades occurred in years that witnessed
higher overall debt as compared to the previous year.
3.50 Figure 40 shows India’s consumer price inflation (annual per cent change) in relation to
sovereign credit ratings changes during 1998-2020. The pattern of correlation between inflation
and changes in sovereign credit ratings is not clear.